


Draftmetrics
Draftmetrics
The NFL's minor league - Reviewing the colleges

Welcome to an All Access Football free preview of Draftmetrics brought to you by insidetheleague.com.
In today’s email:
Draftmetrics - Reviewing the colleges
Quantitative analyst Anthony Villiotti explores the NFL's minor league.
Have a question about Draftmetrics? Email me
Let’s get started

With rare exceptions, there is only one path to the NFL - - through the colleges. In the first part of a two-part article this analysis will focus on the big picture regarding the colleges that supply the most players and how successful those players have been. Part 2 will focus on analysis of a group of individual colleges.
It is not surprising that the 65 Power 5 schools are the training ground for most NFL players. Based on a study of the 2012 through 2020 drafts, about 75% of all draftees are from Power 5 schools. This study excludes special teams selections. Here is a list of conferences and the number of draftees from each

It should be noted that Boise State had the most draftees (22) from schools outside the Power 5. Digging a little deeper, 31 colleges (called “the Group” in the rest of the article) in the Power 5 accounted for over half of all drafted players. The 31 schools and the number of draft from each are:
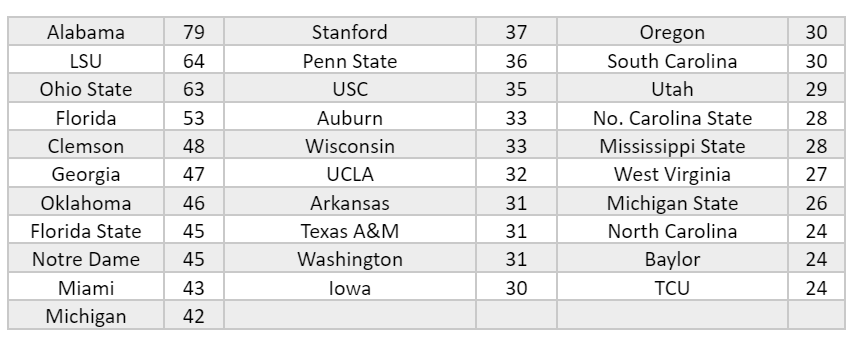
It is no surprise that SEC schools dominate the list with nine schools, representing nearly 18% of all draft selections. The Big 10 is a distant second representing just over 10% of all draft choices.
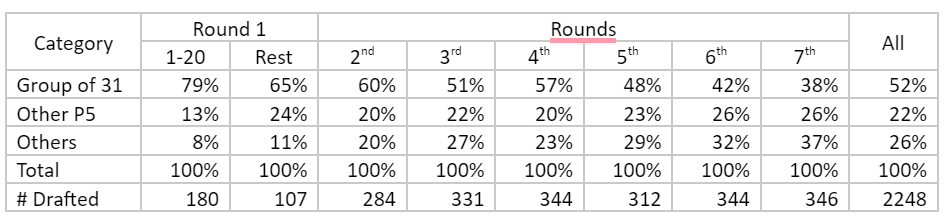
The Group tends to be most dominant in the early rounds of the draft. This table compares the percentage of drafted players from three categories of schools in each segment of the draft. The categories are 1) Group of 31, 2) the other 34 Power 5 colleges and 3) everyone else.
Do players from one category tend to be more successful than the others? This can be reviewed from both an absolute and relative (i.e., considering when draft choices were made) perspective. The following data summarizes the data, with fullbacks excluded due to their small number of draft choices, Major Contributors and Contributors.

As the table shows, in absolute terms the Group dominates, producing 57% of all Major Contributors. But there is a different result when an algorithm is used to calculate how many Major Contributors and Contributors those draft choices should have produced and that is compared with the actual number.
This table compares the variances by playing position and overall between actual and projected for each category of schools. A plus sign (+) indicates that actual exceeded projected and a minus sign (-) indicates the opposite.
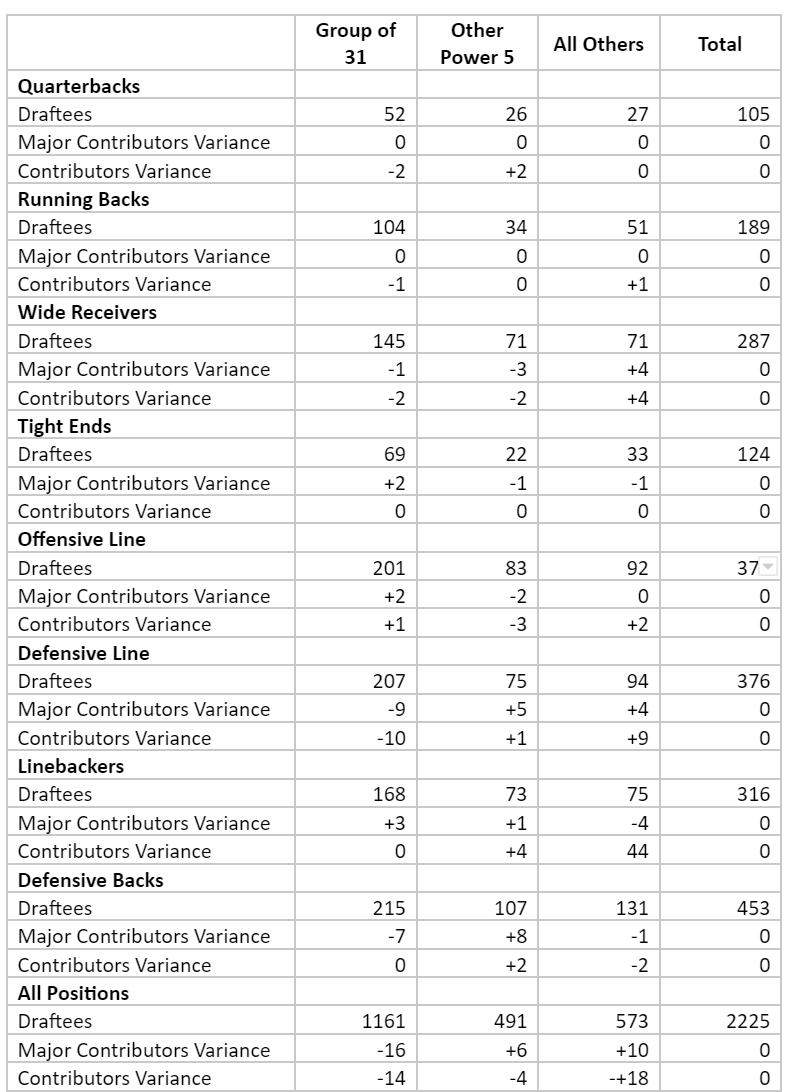
As this table indicates, the Group produced 16 fewer Major Contributors than would have been expected. This is just over 1% less than expected, so not a great difference but a difference nonetheless. Draftees from schools outside the Power 5 produced over 1% more than expected. This could be interpreted to indicate that players from the Group are a tad over-drafted. As you can see most of the differences are on the defensive side of the ball.
This table provides a summary for offense and defense.
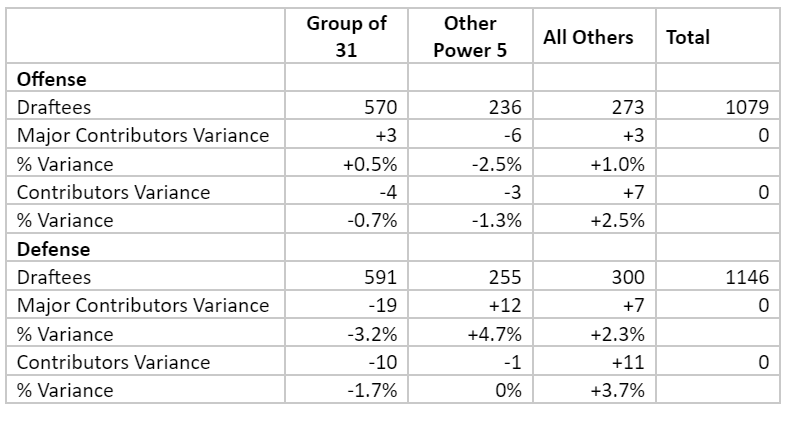
This table shows that on offense, each category produces players roughly as expected. There are more significant differences on defense. An earlier table reflects that the biggest differences are defensive line (where the Group produced about 4% fewer Major Contributors than expected) and defensive back (where the Group produced about 3 % fewer Major Contributors than expected). Combined the two positions account for the entire amount of the Group’s negative variance.
COMING UP: An analysis of the individual schools with the Group.
Have a question about Draftmetrics? Email me

All Access Subscribers Receive The Following Benefits (Draftnik Heaven):
“The most in-depth draft guide ever seen.” – Dick Vermeil, 2022 Pro Football HOF Inductee
The most accurate big board over the past two decades featuring projections for 2023 and beyond
In-depth scouting report library with thousands of prospect profiles for past, present and future
Verified player measureables, personal background information, medical history and historical stats
Dedicated, year-round coverage with on-site campus visits across the country
On location reporting from the all-star circuit, combine, pro days and draft

Ric Serritella on Sports Illustrated
2023 NFL Draft Big Board & Position Rankings
Copyright © 2022 Anthony J Villiotti, 63 Stancey Road, Pittsburgh, PA 15220
This publication, or any part thereof, may not be reproduced or transmitted in any form or by any means, electronic or mechanical, or by photocopying, recording, storage in an information retrieval system of otherwise, without the prior written consent of Anthony J. Villiotti